CSS Tables with Fixed Headers
I’ve been using a table in one of my web applications for a while that’s bothered me. The table displays NetFlow data and may contain many thousands of lines with fields of varying lengths (e.g., shorter fields for IPv4 addresses and longer fields for IPv6 addresses). To allow for maximum flexibility, I’ve defined the table using percentages so that it can be expanded to full screen or to occupy a smaller window.
The aspect that bothered me the most was the header. To get the labels to line up correctly, the header needed to be part of the larger table to accommodate the flexible field widths; if I wanted the labels to line up, it could not be defined as an outer table with an inner div that allowed for scrolling as many sites suggest. This meant that the header would scroll off the page when the data was accessed. However, I finally figured out a way to overcome that difficulty.
I use a lot of JavaScript in this application, so relying on that to resize fields doesn’t give me much heartache. I figured out that I can query the inner elements for their offsetWidth after they’ve been added to the table and then dynamically style the header field widths to match. Below is my example.
Given this structure:
<table class="flows">

  <thead id="flow-header">
    <tr>
      <th id="start">Start Time</th>
      <th id="protocol">Type</th>
      <th id="source">Source Address</th>
      <th id="sport">Port</th>
      <th id="destination">Destination Address</th>
      <th id="dport">Port</th>
      <th id="flags">Flags</th>
      <th id="size">Size</th>
    </tr>
  </thead>

  <tfoot id="flow-footer">
    <tr>
      <td>Start Time</td>
      <td>Type</td>
      <td>Source Address</td>
      <td>Port</td>
      <td>Destination Address</td>
      <td>Port</td>
      <td>Flags</td>
      <td>Size</td>
    </tr>
  </tfoot>

  <tbody>
    <tr>
      <td colspan="8">
        <div id="flow-table">
          <table id="flow-data"></table>
        </div>
      </td>
    </tr>
  </tbody>

</table>
…I can use this JavaScript snippet to resize the th fields (and by extension the footer td fields) to match the data that is pulled in via AJAX to the “flow-data” table:
$('start').style.width = $('flow-data').childNodes[0].childNodes[0].offsetWidth + "px";
$('protocol').style.width = $('flow-data').childNodes[0].childNodes[1].offsetWidth + "px";
$('source').style.width = $('flow-data').childNodes[0].childNodes[2].offsetWidth + "px";
$('sport').style.width = $('flow-data').childNodes[0].childNodes[3].offsetWidth + "px";
$('destination').style.width = $('flow-data').childNodes[0].childNodes[4].offsetWidth + "px";
$('dport').style.width = $('flow-data').childNodes[0].childNodes[5].offsetWidth + "px";
$('flags').style.width = $('flow-data').childNodes[0].childNodes[6].offsetWidth + "px";
$('size').style.width = $('flow-data').childNodes[0].childNodes[7].offsetWidth + "px";
Obviously, I use prototype.js to make my life a little easier, but that’s the extent of the JavaScript frameworks that I employ.
The result is a table wherein the header fields are dynamically resized to match the content that is pulled in to the DOM (gradually – as the scrollbar moves down the table).
*I’ll probably get rid of all those ID tags, since I should be able to refer to them relative from their parent elements.
CyanogenMod 7 and Vyatta/OpenVPN
Shortly after I purchased my HTC Incredible late last year to replace my iPhone 3GS, I began to think about how I could take advantage of the more open nature of the Android OS. Recently, I decided to ditch the standard Android 2.2 system and upgrade to Gingerbread a la CyanogenMod 7 (CM7).
One of the first things I noticed after the move to CM7 was that a new option appeared in the VPN settings for OpenVPN. That piqued my interest as I already knew that I had a system ready to act as an OpenVPN server (my Vyatta 6 firewall).
After reading about Google’s latest Android security problems with devices connected over unsecured WiFi networks, I decided to take a little bit of time to figure out how to better secure my wireless handset data connection. Here are the steps necessary to configure the Vyatta system to act as an OpenVPN server suitable for serving Android clients:
- Using SSH, log in to the Vyatta system as root and move in to the /usr/share/doc/openvpn/examples/easy-rsa/2.0 directory.
- Modify the “vars” file with the correct certificate details (in my file, this is the very last section). You can also change the KEY_DIR variable if you want to create your keys somewhere other than the keys subdirectory in the current directory.
- Read in the variables:
source ./vars
- Create two files in the keys directory:
touch $KEY_DIR/index.txt
echo 01 > $KEY_DIR/serial
- Create the Certificate Authority certificate:
./build-ca
- Create a key for your OpenVPN server and build the Diffie-Hellman exchange file (replace “vyatta” with the name of your firewall; mine is predictably called, “vyatta”):
./build-key-server vyatta
./build-dh
- Create a key for your specific Android phone (I just called my key “android”):
./build-key android
With the keys generated, you now need to configure the Vyatta firewall to enable the OpenVPN functionality. For this example below, my DNS server is at 192.168.1.10 and I want the Android phone to be able to access that and other servers on the 192.168.1.0/24 subnet. I’ve also chosen 172.16.1.0/24 as my VPN client subnet. Change the “openvpn-option” and “subnet” strings to whatever you need for your environment. I also assume that the keys were built in the default, /usr/share/doc/openvpn/examples/easy-rsa/2.0/keys/ directory; change that configuration option to match your previous decisions. The names “vyatta.crt” and “vyatta.key” will need to match whatever you chose for your firewall name above.
configure
set interfaces openvpn vtun0 encryption aes256
set interfaces openvpn vtun0 mode server
set interfaces openvpn vtun0 openvpn-option "--push dhcp-option DNS 192.168.1.10 --push route 192.168.1.0 255.255.255.0"
set interfaces openvpn vtun0 server subnet 172.16.1.0/24
set interfaces openvpn vtun0 server topology subnet
set interfaces openvpn vtun0 tls ca-cert-file /usr/share/doc/openvpn/examples/easy-rsa/2.0/keys/ca.crt
set interfaces openvpn vtun0 tls cert-file /usr/share/doc/openvpn/examples/easy-rsa/2.0/keys/vyatta.crt
set interfaces openvpn vtun0 tls dh-file /usr/share/doc/openvpn/examples/easy-rsa/2.0/keys/dh1024.pem
set interfaces openvpn vtun0 tls key-file /usr/share/doc/openvpn/examples/easy-rsa/2.0/keys/vyatta.key
commit
save
At this point, the Vyatta firewall is prepped and ready to accept connections from your Android device. The last steps necessary are to transfer the certificate over to your phone and configure CM7 to connect to your server. Before you transfer the certificate, you’ll need to merge the files into a format that can be consumed by CM7. While still logged in to the firewall, issue the following commands:
openssl pkcs12 -export -in $KEY_DIR/android.crt -inkey $KEY_DIR/android.key -certfile $KEY_DIR/ca.crt -name CM7 -out ./certs.p12
Move that certs.p12 file over to the /sdcard/ directory on your Android phone (that location is important for some, bizarre reason – the only option available in CM7 is to install the certificate “from SD card”). I use QuickSSH to launch an SSH server on the Android phone and push the file over to the proper location.
With that file in place, navigate to the main settings on the Android phone and select “Location & security.” From there, select “Install from SD card” to load up your OpenVPN certs. Follow the prompts and create a credential storage password as requested; don’t forget that password as you’ll need it every time you start the VPN after booting the phone.
From the main settings menu, select “Wireless & network settings” and “VPN settings.” Instruct the phone to “Add VPN” and specify that you want to “Add OpenVPN VPN.” Give your VPN any name you want and set the VPN server to your external Vyatta interface. Set the CA certificate to the cert you previously installed from the SD card and the user certificate to the same. Set the DNS search domain to include your internal domain if you are so inclined.
Select “Menu” and “Advanced.” Ensure that your settings are as follows:
Server port: 1194

Protocol to use: udp

Redirect gateway: Enabled

Remote Sets Addresses: Enabled

Cipher algorithm: AES-256-CBC

Size of cipher key: 256
With that, select Back, Menu, and Save.
At this point, you should be able to select your VPN and it should connect right up. Using a terminal application on your phone (or an SSH server), you can verify that your traffic is encrypted. This is what mine looks like while I’m browsing the web on my phone (I’m connected via SSH and using ‘tcpdump “not port 22″‘ to view the traffic; port 22 traffic is excluded because I’m connected to the internal VPN client address (172.16.1.2) and as such that traffic is visible):
19:45:48.642230 IP 10.239.31.236.37332 > 24.X.X.X.openvpn: UDP, length 101

19:45:48.655078 IP 24.X.X.X.openvpn > 10.239.31.236.37332: UDP, length 213

19:45:48.678271 IP 10.239.31.236.37332 > 24.X.X.X.openvpn: UDP, length 101

19:45:48.693347 IP 24.X.X.X.openvpn > 10.239.31.236.37332: UDP, length 101

19:45:48.693927 IP 10.239.31.236.37332 > 24.X.X.X.openvpn: UDP, length 1141

19:45:48.699847 IP 10.239.31.236.37332 > 24.X.X.X.openvpn: UDP, length 309

19:45:48.713336 IP 24.X.X.X.openvpn > 10.239.31.236.37332: UDP, length 101

. . .
To my delight, I’ve found that the VPN functionality of CM7 is quite stable. I’ve configured my internal network to resolve my external VPN DNS name to the internal interface of the firewall. What this means is that when my phone is in range of my WiFi, the WiFi connects and the VPN renegotiates with the internal address – silently. When I leave the house, the VPN automatically reconnects to the external address; from the CM7 VPN perspective, it’s the same DNS name (a dyndns.org URL), but the underlying address changes based on whether the phone is connected locally or remotely. The upshot is that my VPN is always connected; I don’t really have to worry about it at all. It works surprisingly well. One caveat: you won’t be able to connect to addresses on the same client subnet when connected via WiFi after the VPN is established. For me, that meant that my DNS server was inaccessible – I addressed that problem by creating a destination NAT on the Vyatta to redirect port 53/udp on the firewall’s vtun0 interface to port 53/udp on my DNS server. I then pushed the firewall vtun0 interface IP as the DNS server to the connected VPN clients. Problem solved (although it would be smarter of me to move my server on to a different subnet than my clients, but that’s a task for another day).
The only unsolvable challenge (thus far) I’ve run into is with using the Portable Hotspot functionality of CM7 – something with the routing is messed up (even though it looks fine using ‘ip route’ on the phone) and will not work properly when the VPN is enabled. I never see the packets move over to the phone’s tun0 interface, so the packets are definitely getting hung up in the phone. That’s not a deal breaker for me, though.
Thanks to Kamil Figiela and DestinyBlog for some of the details related to OpenVPN certificate configuration and certificate bundling for CM7.
SVG Matrix Transformations and JavaScript
No matter how much you might resist using matrix transformations with SVG documents, if you intend to modify an image dynamically (and cumulatively), matrixes are your only viable option.
Many sites tell you that you should use matrixes, ostensibly for speed purposes. In my opinion, speed is not the issue. The issue is the complexity associated with applying multiple transformations to an element; you just can’t do it with simple transformations (e.g., rotate, translate, skew and/or scale).
Here are a few notes about the stumbling blocks that I encountered in my journey towards using matrix transformations:
- Most online guides seem to assume that you will be working with a static image; they tell you how to convert simple transformations to matrixes as a one-time operation, but give you no (straightforward) information on how to subsequently alter those transformations dynamically. The JavaScript method, element.getCTM() is your key to handling this situation. By using this method (short for get Current Transformation Matrix), you can obtain a matrix that includes all of the transformations currently applied to your graphic element. That matrix can then be used to generate updated matrixes after applying dynamically updated transformations.
- The sylvester.js JavaScript library is a great resource to handle your matrix math needs. You’ll use the method matrix.x() to multiply the current matrix with the matrix representing the transforms you want to apply to obtain your newly combined matrix to apply to your DOM element.
- Some guides talk about changing the matrix.e and matrix.f variables directly to apply translation transformations. When dealing with multiple transforms, that will just cause you a world of grief (e.g., rotation transforms update the e and f variables in complex ways that are difficult to calculate without matrix math).
- Rotation transformations use sine and cosine methods extensively. At first glance, one would think that the JavaScript methods Math.sin() and Math.cosin() would work nicely. They do, but keep in mind that those methods deal in radians, not degrees. If you want to rotate something in (e.g., 45) degrees, you’ll need to convert that value to radians (e.g., 0.785398163) before using those methods.
- You should be able to combine a translation transformation with a rotation transformation in a single matrix to choose the center of rotation, but I haven’t been able to get that to work. Instead, I perform a pre-shift to move my desired rotation point to the origin and then a post-shift to move it back after the rotation. That seems to work reliably and allows me to rotate the graphic where my pointer is hovering.
Here is an example of how I have implemented these concepts in my Flower Network Flow Analysis Visualization server (I also have some prototype.js markup in here and this.nonce refers to a random, one-time string I use to distinguish between multiple, similar, generated SVGs existing in a single DOM):
var content = $('content_' + this.nonce);
var matrix = content.getCTM();

var map = $('map');

var leftVal = map.offsetLeft;
var topVal = map.offsetTop;
var parent = map.offsetParent;

while(parent != null) {
	leftVal += parent.offsetLeft;
	topVal += parent.offsetTop;
	parent = parent.offsetParent;
}

var pointerX = event.clientX - leftVal;
var pointerY = event.clientY - topVal;

var radians = rotation * (Math.PI/180);
var cos = Math.cos(radians);
var sin = Math.sin(radians);

var current = $M([[ matrix.a, matrix.c, matrix.e ], [ matrix.b, matrix.d, matrix.f ], [0, 0, 1]]);
var preshift = $M([[ 1, 0, -pointerX], [0, 1, -pointerY], [0, 0, 1]]);
var rotated = $M([[cos, -sin, 0], [sin, cos, 0], [0, 0, 1]]);
var postshift = $M([[ 1, 0, pointerX], [0, 1, pointerY], [0, 0, 1]]);

var updated = postshift.x(rotated.x(preshift.x(current)));

content.setAttribute("transform", "matrix(" +
	updated.e(1, 1) + " " + updated.e(2, 1) + " " +
	updated.e(1, 2) + " " + updated.e(2, 2) + " " +
	updated.e(1, 3) + " " + updated.e(2, 3) + ")");
The basic operations above are:
- Obtain the current transformation matrix. (lines 1 and 2)
- Determine how far the pointer is from the edges of the map DIV using offsetLeft and offsetTop. (lines 4-17)
- Pre-calculate the sine and cosine values of the desired rotation (convert to radians as an intermediate step). (lines 19-21)
- Convert the SVG matrix to a sylvester.js matrix ($M). (line 23)
- Build the pre-shift transformation matrix. Translation matrixes are constructed thusly, with X and Y being the number of pixels the graphic should be shifted in the X and Y directions, respectively (line 24):
  [ 1, 0, X ]
  [ 0, 1, Y ]
  [ 0, 0, 1 ]
- Build the rotation transformation matrix. Rotation matrixes are constructed thusly, with R being the rotation value (line 25):
  [  cos(R), sin(R),   0 ]
  [ -sin(R), cos(R),   0 ]
  [       0,      0,   1 ]
- Build the post-shift transformation matrix. (line 26)
- Calculate the updated matrix; note that the order of operations is important. I’m not precisely sure about the rules that apply here (I kind of guessed until I got the order right, to be perfectly honest). The really important thing to remember is that matrix multiplication is apparently sensitive to order (unlike simple multiplication). (line 28)
- Apply the updated matrix to your graphic element. Note that in my example above I’m using the sylvester.js (row, column) notation. The actual matrix() transform only uses the first six values of the full matrix – the last row of 0, 0, 1 never changes and should not be specified. (line 30-33)
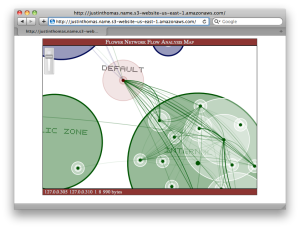
By way of example, and if you have a newer version of Firefox, Chrome, Safari, Epiphany (or shockingly, even IE9!), visit a mock-up of a generated network map here. For anyone else, here is a still screenshot of a map that’s been twisted, translated and scaled.
If you do visit that page, try using your mouse wheel to rotate the map or the graphical slider to zoom in and out. You can also just drag the map around to reposition it. Clicking on a connection will open a small detail box and clicking on a node will narrow the display to only connections involving that node. Clicking on subsequent nodes will add those nodes’ connections. Double clicking in the white space will cause all connections to be visible again. Hovering over a connection or node will show you that connection or node’s details (at the bottom of the graphic). The information in there is mostly nonsense – I went through and “sanitized” the addresses – although protocol, port and volume information are real.
I hope the above information helps someone else! I know it would have saved me a lot of time to have a working example of JavaScript code that updates a transformation matrix dynamically based on DOM events.
Snort IDS Events and Flower
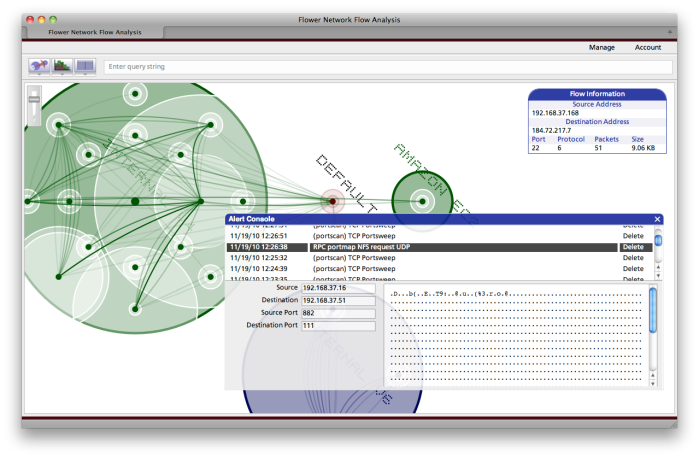
Over the last couple of weekends I’ve added the ability to capture and report on alerts generated by Snort IDS sensors. The additional code consists of: modifications to the Analysis Server to store and retrieve IDS related data, modifications to the Visualization Server to present that IDS data in a meaningful manner, and a new Python-based module that is installed on the IDS sensor itself.
That last component opens a local UNIX domain socket on the sensor. Snort is then configured to log alerts to that socket. When data is received on the open socket, the Python code parses the alert and opens a web services connection to the Analysis Server to deliver the results.
This is what the interface currently looks like with those modifications:
I only recently deployed the Snort sensor and it has not been tuned yet; that’s why we see so many “(portscan)” alerts in the console above. I’m viewing the last 24 hours worth of alerts in this shot and have zeroed in on one of the less frequent alerts. All of the alerts shown are false positives, but their generation is good for my testing.
I haven’t added the Python code to GitHub, but will be doing so shortly. I also plan to post another entry on this blog about configuring XenServer with Open vSwitch to better accommodate IDS functionality. I recently installed that software and configured a mirror port to monitor all local network activity on my VM server for the Flower Analysis server. The difference (from just using “promiscuous mode” on an interface) in visibility and efficiency is striking.
That vSwitch software comes with a bit of a learning curve, but the functionality it enables is very cool.
Flower NFA Update
I’ve made some significant updates both to the Flower Visualization Server and to the supporting Analysis Server:
- Visualization Server
- I implemented changes necessary to support the additional resolutions noted in the Analysis Server section. This is transparent to the end-user (the proper resolution is automatically selected).
- New dialog boxes were added to support AD configuration.
- Many, minor aesthetic changes were made to the Network Map output.
- Fonts (@font-face) are used more consistently throughout the workings of the console.
- The most significant recent changes to the Visualization Server are in the area chart output:
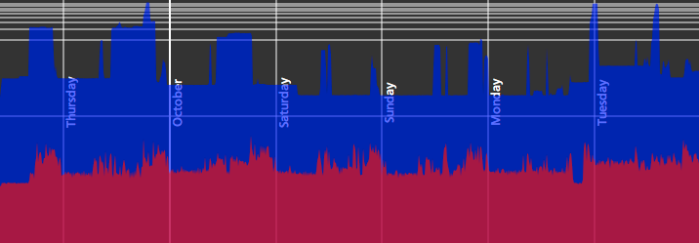
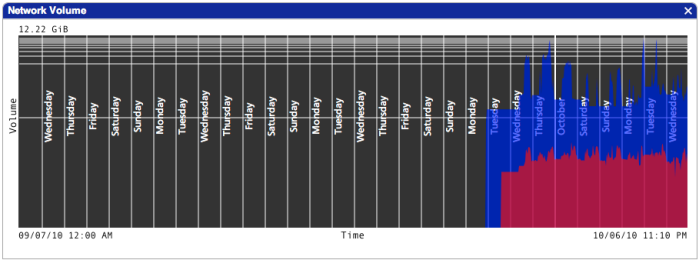
I changed the chart from arithmetic to logarithmic because I found that my UDP data was being pushed down to 1 pixel as it was tremendously outweighed by the TCP data. Horizontal scale lines were added to illustrate the fact that the bottom of the graph represents an amount of data many orders of magnitude less than the top of the graph. I also wrote code to insert vertical lines at the beginning of each hour, day and month to better make sense of the data. Here is a 30-day graph shown within it’s containing window (data older than a few days is not pictured because I had to reset the database when I implemented the resolution concept):
- Analysis Server
- In line with the changes I noted in my last update to how statistical flow data is stored, I’ve introduced multiple levels of summarization to greatly decrease the time it takes to complete queries for longer time durations. The levels are configurable, but presently data is stored in 10 second, 1000 second, and 10000 second resolutions.
To put that in to perspective, at a resolution of 10 seconds, a query for 30 days worth of data would need to scroll through 259,200 records. That same query would need to traverse only 2,592 records at a 1,000 second resolution and only 260 records at a 10,000 second resolution. - I updated the chart data generation code to take advantage of the new resolution levels. Network maps represent data within a time period with little regard for how that data is distributed, so we can use a very low resolution and access the data very quickly.
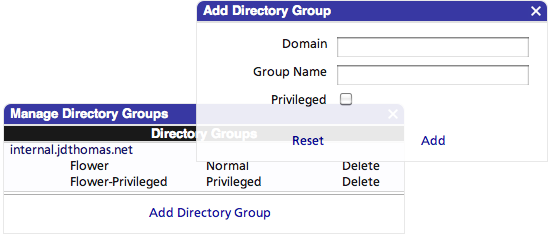
Area charts are more sensitive to how data is distributed throughout a time period and I’ve updated the code to dynamically select a resolution based on the width (in pixels) of the ultimate output and the time period selected. For example, a chart that is 600 pixels wide wouldn’t be well supported by a 30 day query split into 260 intervals. The Analysis server would select a 1,000 second resolution (2,592 intervals) to provide an adequate level of granularity with an optimal query structure. - Microsoft Active Directory (AD) may now be used as an authentication and authorization source with minimal configuration. I’ve implemented code that interfaces with AD servers using LDAP/S (or optionally, and highly discouraged, over LDAP). AD servers are identified automatically by leveraging SRV records provided by the DNS server used by the Analysis Server.
To enable this capability, an administrator need only specify the fully-qualified domain name of the forest root (e.g., “internal.company.com”) and the group(s) to authenticate against. Each group can be specified as “privileged” to permit management of the Flower systems themselves.
No AD user data is stored within the Flower systems and all communication occurs over SSL (unencrypted authentication may be selected, but that option is not exposed yet and would be highly dangerous if not handled properly). Importing the SSL certificate from AD into the GlassFish server is a little tricky, and I’ll write up a wiki entry for that soon. Java is very particular about working only with trusted certificates. It is, of course, essential that it be so.
- In line with the changes I noted in my last update to how statistical flow data is stored, I’ve introduced multiple levels of summarization to greatly decrease the time it takes to complete queries for longer time durations. The levels are configurable, but presently data is stored in 10 second, 1000 second, and 10000 second resolutions.
- Overall Updates
- The whole system may be configured to use SSL (from Visualization to Analysis and from Analysis to Active Directory). I have had great success using StartSSL’s free certificates.
- Both the Visualization and Analysis servers may (should!) be installed behind an Apache server. I prefer this because it permits me to use Apache for SSL and mod_security. I’ve found that mod_proxy works best for the Visualization server and mod_jk works best for the Analysis server (mod_proxy with Analysis causes the WSDL files to be generated with “localhost” as the destination and mod_jk seemed unstable with the Visualization server).
To try all of this out for yourself, download, compile and install the Analysis Server from the GitHub repository and head over to http://app.jdthomas.net and log in to your new Flower Network Flow Analysis system.
OpenIndiana and XenServer
Now that OpenSolaris is officially dead and the drama has died down a bit, I thought it might be time to figure out how to install OpenIndiana on my XenServer. I’ve heard some say that you can’t install the new distribution on Xen as a domU, but that is demonstrably incorrect (although as I understand it, dom0 is presently out of the question due to Oracle pulling out the relevant xVM bits).
Installing OpenIndiana 147 on XenServer 5.5 is nearly identical to installing OpenSolaris on the same (as would be expected considering OpenIndiana’s roots).
- Create a new VM using the “Other Install Media” profile within XenCenter. Set up the VM with 10GB of disk space and 1GB of RAM.
- Copy the /platform/i86xpv/kernel/amd64/unix and /platform/i86pc/amd64/boot_archive files from the OI install disk over to the XenServer host.
- On the XenServer, determine the UUID of the newly created OpenIndiana VM using
xe vm-list; just note the first 3 or 4 characters and tab completion will enter the rest when necessary. - Configure the following parameters:
xe vm-param-set uuid=<vm uuid> PV-kernel=<full path to the 'unix' file on the XenServer>xe vm-param-set uuid=<vm uuid> PV-ramdisk=<full path to the 'boot_archive' file on the XenServer>xe vm-param-set uuid=<vm uuid> PV-args='/platform/i86xpv/kernel/amd64/unix -B console=ttya'xe vm-param-set uuid=<vm uuid> HVM-boot-policy=xe vm-param-set uuid=<vm uuid> PV-bootloader=
- Mount the OpenIndiana install CD in the appropriate drive (e.g., select the correct ISO in XenCenter)
- Boot the OpenIndiana VM. Log in as jack/jack when appropriate to do so.
- Configure basic networking if needed; my Windows 2008 DHCP server never works to assign addresses to OpenSolaris/OpenIndiana (for whatever reason) so this is generally a mandatory step.
- Connect to the OpenIndiana server with an SSH client with X-tunneling enabled using the jack/jack account.
- Execute:
pfexec /usr/bin/gui-install. The graphical install process will begin. Complete the steps as requested. - After the installation is completed (and before rebooting), change the PV-args on the XenServer to:
xe vm-param-set uuid=<vm uuid> PV-args='/platform/i86xpv/kernel/amd64/unix -B console=ttya,zfs-bootfs=rpool/ROOT/openindiana,bootpath="/xpvd/xdf@51728:a"'. Note the two changes from the OpenSolaris instructions from an earlier blog post: the zfs-bootfs is openindiana, not opensolaris and the bootpath is 51728 instead of 51712. I have no idea why the latter change is necessary – I just know that there was no 51712 in my devices directory, only 51728 and a 51760.
Reboot, and you’re good to go! Remember to run bootadm update-archive after the first boot (and anytime you make changes that require that file to be updated) and copy out the updated /platform/i86pc/amd64/boot_archive to the XenServer before rebooting.
Here’s a screenshot; note that I don’t know what’s up with the savecore error. Considering the unstable nature of the code, those sorts of hiccoughs don’t surprise me.
Might need an adjustment . . .
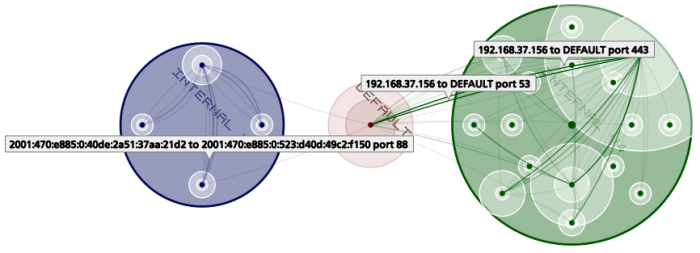
I think it might be time to add a sensitivity parameter to my network mapping code:
That’s the result of me running an nmap scan on my internal network to track down the IP address of an old network switch that I recently connected (which I don’t have the proper gendered serial connector to connect in to at the moment).
I suppose the upside is that it’s easy to see when someone is scanning my network.
Git Repository Available
I’ve published the Analysis Server code out to GitHub.com. Instructions for building and deploying the server from source (using Ant – NetBeans is not required) are included on the Wiki.
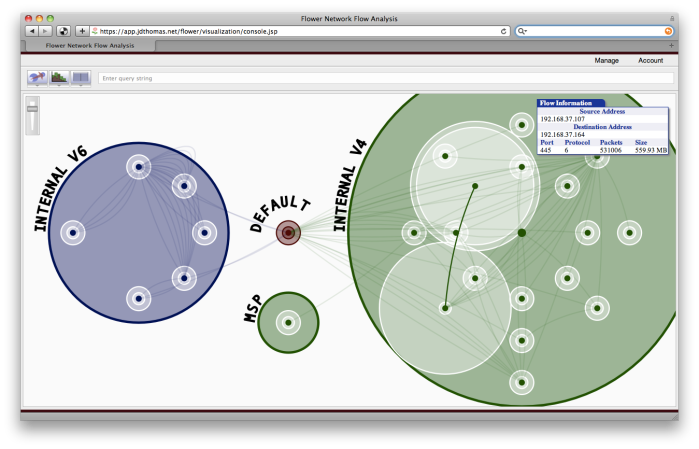
This is a screenshot of the Visualization interface as currently available at https://app.jdthomas.net:
I’ve made some fundamental changes to how data is stored within the Analysis Server (see StatisticsManager.java on GitHub for details). Instead of building the charts off of raw NetFlow data, those flows are now normalized according to time increment (set at a 5 second interval currently). This allows me to query based on a time specified time frame without worrying about how to handle the start and stop times that might fall outside of that range. It also sets up a scenario where we can derive some interesting statistical information from the data; more on that to come soon, hopefully.
I’ll update the EC2 AMI soon and remove the old image in favor of the new. I’m planning to also add Apache and mod_security to that server to protect the web service better for anyone who chooses to use that service.
Flow Patterns
I’ve been noticing some interesting patterns using my Flower Analysis tool.
For whatever reason, I’ve noticed that one of my servers is continually chatting (in 3.2 – 4MB increments) with a whole lot of servers at Google. These chats generally occur over port 80/tcp. I first noticed the traffic in an area chart that showed a spike pattern in a very consistent rhythm. I tracked down the destination addresses of the flows and determined that they belong to networks owned by Google. I then added those networks to my map.
I’ll be doing more research on this; I’m at a loss as to why this one server would be sending (or receiving) so much information to (or from) Google.
I suspect espionage.
Flower EC2 AMI Available
Here is a current shot of the Flower console:
I’ve made an EC2 AMI of the Analysis Server available on Amazon’s AWS. If you’d like to try the system out and already have EC2 configured, follow these instructions:
1. Configure a security group that allows ports 22/tcp, 8080/tcp, and 9995/udp
2. Create an EC2 instance of ami-3857bf51; the command I use is (my security group is called “appserver”):
ec2-run-instances -g appserver ami-3857bf51
3. Once loaded, log in via SSH and start the Flower server (all passwords are set to “flower” by default):
asadmin start-domain flower
4. Use http://app.jdthomas.net to log in to your server; in the server field, enter “http://%5BEC2 IP Address]:8080” and both the username and password are “flower” – just hit [Enter] on any field to submit the form (there is no button)
Of course, app.jdthomas.net will need access to your EC2 system on port 8080/tcp (it uses JAX-WS to access and present your data to you), so if you lock things down be sure to account for that. HTTPS works, but you’ll need to configure and use a valid certificate on your EC2 system.
You can now configure your NetFlow exporters to send to the IP address of your EC2 instance on UDP port 9995 (version 9 only). I use softflowd on a couple of Debian systems with this command:
softflowd -i eth0 -n [EC2 IP Address]:9995 -p /var/run/sfd.pid.ec2 -c /var/run/sfd.ctl.ec2 -v 9
Configure your server using the “Manage” menu in the web application. Be sure to add networks (use CIDR addressing like 192.168.1.0/24) and users. Specified networks are required for the map, but area charts and flow tables will work without any networks specified.
E-mail me at justin@jdthomas.net with any questions! There are lots and lots of bugs and missing features, but I’ll get to them over the coming months.
UPDATE: I made a few changes tonight to improve the Visualization server configuration; the URL is now http://app.jdthomas.net (this will redirect you to an SSL site of the same base but with a longer path). I’ve made that change in the text above as well.
